

High-performance visualization
High-performance visualization capabilities are available on ARC's GPU-enabled clusters: Tinker Cliffs and Cascades.
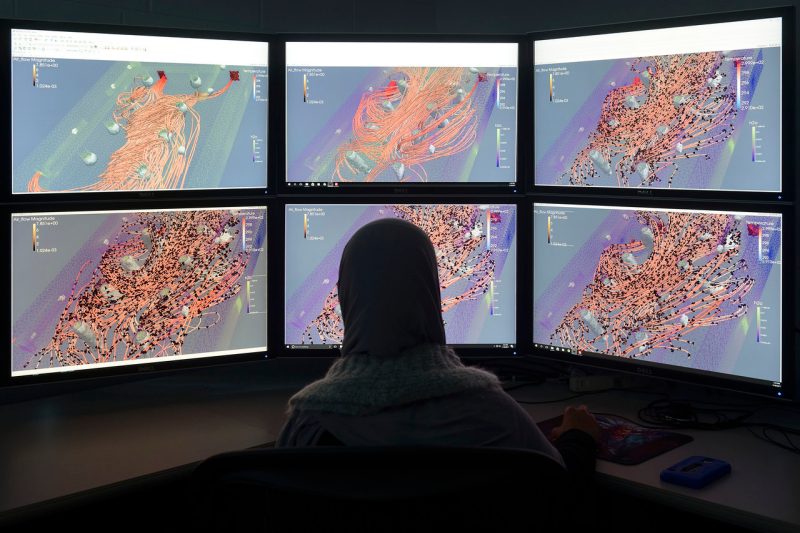
The GPUs in these clusters can be used to accelerate rendering tasks (drawing high- resolution plots, animations, 3D and video), enabling cluster visualization via offline batch usage or real-time remote visualization to thin clients. Both of these visualization models are proven and heavily-used resources in the national labs and Teragrid/XSEDE.
For example, Tinker Cliffs and Cascades include ParaView, an open source application that allow data, computational, and graphic processing to be performed on the cluster. This can be done in two ways:
- Via offscreen batch scripting (e.g. using Python), where the results of the visualization are saved to image or video files.
- During an interactive session, where visualization is viewed and manipulated on the client machine in real-time.
Doing the processing where the data is housed substantially accelerates the speed with which complex rendering can occur. Visualization software packages used include:
- Paraview ( Scientific Visualization )
- TecPlot ( Scientific Visualization )
- FieldView ( Scientific Visualization )
- Parallel Python ( Visual and Data Analytics )
- NAMD ( Scientific Visualization )
- VisIt ( Scientific Visualization )
- VMD ( Scientific Visualization )